Liberal Forum
Archive
‹
Political Chat Rooms
‹
No Holds Barred Political Forum
‹
Are Dems happy Trump executed the head of TDA?
Are Dems happy Trump executed the head of TDA?

By PhiloBeddo
14 Jun 2026 3:34 pm in No Holds Barred Political Forum
16 posts • Page 1 of 1
14 Jun 2026 3:34 pm


14 Jun 2026 4:23 pm
Do any MAGAts give a flying ****?
They're busy trying to figure out how to afford food and gas.
They're busy trying to figure out how to afford food and gas.
DUMP THE TRUMP SLUMP 2026!
Bump Caps Recommended..
Bump Caps Recommended..
14 Jun 2026 4:24 pm
You're supposed to be pumping ET Files.
Epstien and Trump are in those too.
Epstien and Trump are in those too.
DUMP THE TRUMP SLUMP 2026!
Bump Caps Recommended..
Bump Caps Recommended..

15 Jun 2026 3:11 am
I'm not having trouble affording anything. Gas is now trending back down. Hell, nothing out there is any more expensive than it was during the Biden regime. And in the Bidumb regime, the stock market was **** on top of it all.JohnnyYou » 14 Jun 2026, 4:23 pm » wrote: ↑ Do any MAGAts give a flying ****?
They're busy trying to figure out how to afford food and gas.
Unlike you, I am not a partisan-based hack. I will gladly admit that I'm not happy with the cost of living, etc... But I know for a fact that Trump is still a ten-fold better choice than any of the **** Democrats have to field.
Johnny You: "Flying the pride flag is honorable".
15 Jun 2026 4:15 am
Over the last six years, inflation in the United States has followed a volatile, "rollercoaster" trajectory, peaking at a 40-year high of 9.1% in June 2022 before cooling significantly and experiencing a recent commodity-driven resurgence to 4.2% as of mid-2026. Driven by pandemic complications, geopolitical disruptions, and fluctuating supply chains, the cumulative impact has resulted in a roughly 28.6% drop in the purchasing power of the U.S. dollar since 2020.A breakdown of the specific eras and economic indicators across this timeframe illustrates the shifting landscape:Chronological Phases (2020 – 2026)2020: The Pandemic BaselineEconomic shutdowns caused demand for travel and energy to plummet.Annual inflation remained subdued at 1.2% to 1.4%, well below the Federal Reserve's target.2021: The Initial SurgePrices jumped rapidly to finish the year at 4.7% (with some months crossing 7%).Widespread supply chain bottlenecks, global shipping delays, and massive government stimulus fueled intense consumer demand.2022: The 40-Year PeakAverage annual inflation reached 8.0%, spiking specifically to a historic 9.1% in June 2022.The Russia-Ukraine war triggered global energy and food shocks, while domestic grocery prices soared by 20% to 25%.The Federal Reserve abandoned its "transitory" stance and began a aggressive tightening cycle, raising interest rates from near-zero to over 4% by year-end.2023 – 2024: The Cooling Period (Disinflation)Inflation cooled significantly down to 4.1% in 2023 and 2.9% by late 2024.Post-pandemic supply chain stresses fully dissipated, and high interest rates began to curb consumer borrowing and spending.2025: StabilizationInflation averaged 2.7%, hovering closer to the Fed's ultimate 2.0% target.Economic metrics began adjusting to the "new normal" of elevated living expenses.Mid-2026: The Energy Shock ResurgenceThe annual inflation rate has accelerated for three consecutive months, hitting 4.2% in May 2026.This latest spike is largely a headline metric inflation driven by an energy shock from conflicts involving Iran, causing retail gasoline prices to jump 40.5%.Core inflation (excluding food and energy) remains more controlled at 2.9%.Broad Economic Metrics SummaryMetric / Indicator6-Year Trend & ImpactPurchasing PowerA consumer basket costing $100 in 2020 requires roughly $128.67 to buy today.Core CommoditiesGrocery and gasoline prices have been the most volatile, fluctuating dramatically based on geopolitics.Shelter & HousingShelter costs remained stubbornly high and sticky, ticking up to 3.4% annually by May 2026.Real EarningsThough wages grew roughly 4% annually, higher prices caused inflation-adjusted "real" wages to decline for long stretches.Monetary ResponseThe Federal Reserve pushed benchmark interest rates above 5%, driving average mortgage rates from 3% to over 7%.Would you like to examine how specific sectors, such as housing markets or food costs, compared during this period, or look closer at the Federal Reserve's rate decisions?SouthernFried » 15 Jun 2026, 3:11 am » wrote: ↑ I'm not having trouble affording anything. Gas is now trending back down. Hell, nothing out there is any more expensive than it was during the Biden regime. And in the Bidumb regime, the stock market was **** on top of it all.
https://i.postimg.cc/pdQzFGj0/dunning-kruger-effect.jpgUnlike you, I am not a partisan-based hack. I will gladly admit that I'm not happy with the cost of living, etc... But I know for a fact that Trump is still a ten-fold better choice than any of the **** Democrats have to field.
DUMP THE TRUMP SLUMP 2026!
Bump Caps Recommended..
Bump Caps Recommended..

15 Jun 2026 5:43 am

The main driver was dumping $4 trillion by democrats keeping the lazy **** at home spending money online…JohnnyYou » 15 Jun 2026, 4:15 am » wrote: ↑ Over the last six years, inflation in the United States has followed a volatile, "rollercoaster" trajectory, peaking at a 40-year high of 9.1% in June 2022 before cooling significantly and experiencing a recent commodity-driven resurgence to 4.2% as of mid-2026. Driven by pandemic complications, geopolitical disruptions, and fluctuating supply chains, the cumulative impact has resulted in a roughly 28.6% drop in the purchasing power of the U.S. dollar since 2020.A breakdown of the specific eras and economic indicators across this timeframe illustrates the shifting landscape:Chronological Phases (2020 – 2026)2020: The Pandemic BaselineEconomic shutdowns caused demand for travel and energy to plummet.Annual inflation remained subdued at 1.2% to 1.4%, well below the Federal Reserve's target.2021: The Initial SurgePrices jumped rapidly to finish the year at 4.7% (with some months crossing 7%).Widespread supply chain bottlenecks, global shipping delays, and massive government stimulus fueled intense consumer demand.2022: The 40-Year PeakAverage annual inflation reached 8.0%, spiking specifically to a historic 9.1% in June 2022.The Russia-Ukraine war triggered global energy and food shocks, while domestic grocery prices soared by 20% to 25%.The Federal Reserve abandoned its "transitory" stance and began a aggressive tightening cycle, raising interest rates from near-zero to over 4% by year-end.2023 – 2024: The Cooling Period (Disinflation)Inflation cooled significantly down to 4.1% in 2023 and 2.9% by late 2024.Post-pandemic supply chain stresses fully dissipated, and high interest rates began to curb consumer borrowing and spending.2025: StabilizationInflation averaged 2.7%, hovering closer to the Fed's ultimate 2.0% target.Economic metrics began adjusting to the "new normal" of elevated living expenses.Mid-2026: The Energy Shock ResurgenceThe annual inflation rate has accelerated for three consecutive months, hitting 4.2% in May 2026.This latest spike is largely a headline metric inflation driven by an energy shock from conflicts involving Iran, causing retail gasoline prices to jump 40.5%.Core inflation (excluding food and energy) remains more controlled at 2.9%.Broad Economic Metrics SummaryMetric / Indicator6-Year Trend & ImpactPurchasing PowerA consumer basket costing $100 in 2020 requires roughly $128.67 to buy today.Core CommoditiesGrocery and gasoline prices have been the most volatile, fluctuating dramatically based on geopolitics.Shelter & HousingShelter costs remained stubbornly high and sticky, ticking up to 3.4% annually by May 2026.Real EarningsThough wages grew roughly 4% annually, higher prices caused inflation-adjusted "real" wages to decline for long stretches.Monetary ResponseThe Federal Reserve pushed benchmark interest rates above 5%, driving average mortgage rates from 3% to over 7%.Would you like to examine how specific sectors, such as housing markets or food costs, compared during this period, or look closer at the Federal Reserve's rate decisions?
https://i.postimg.cc/pdQzFGj0/dunning-kruger-effect.jpg
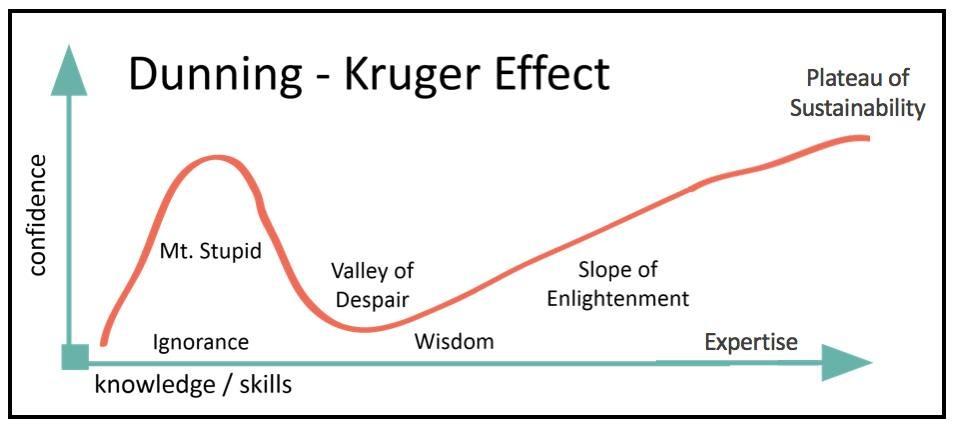
I see you’re still toggling between “Mt Stupid” and “valley of despair”…

 JuCo 5 percenter...72
“Show me the man and I’ll find you the crime” ~ LAVRENTIY BERIA
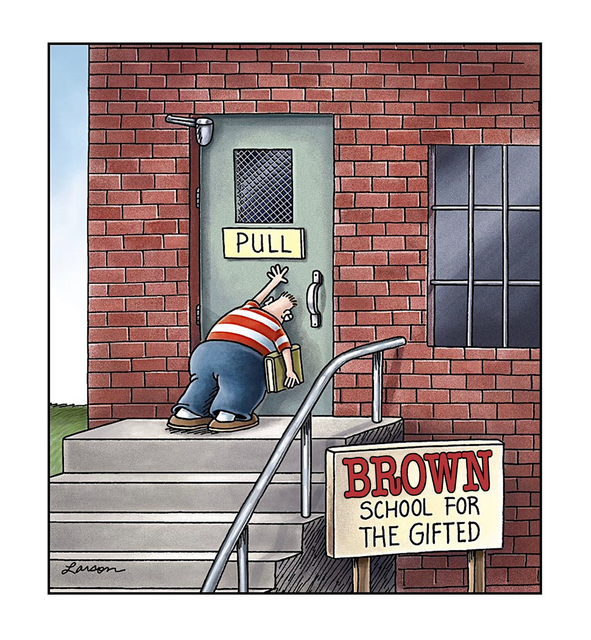
"Try to get past your passionate ignorance and learn to accept what actually happened." ~ brown's unheeded words of wisdom
JuCo 5 percenter...72
“Show me the man and I’ll find you the crime” ~ LAVRENTIY BERIA
"Try to get past your passionate ignorance and learn to accept what actually happened." ~ brown's unheeded words of wisdom  If gender is not sex, why should a gender claim change what sex you shower with?
"Libruls are often fascists on vacation..."
If gender is not sex, why should a gender claim change what sex you shower with?
"Libruls are often fascists on vacation..."
15 Jun 2026 7:34 am
JohnnyYou » 15 Jun 2026, 4:15 am » wrote: ↑ Over the last six years, inflation in the United States has followed a volatile, "rollercoaster" trajectory, peaking at a 40-year high of 9.1% in June 2022 before cooling significantly and experiencing a recent commodity-driven resurgence to 4.2% as of mid-2026. Driven by pandemic complications, geopolitical disruptions, and fluctuating supply chains, the cumulative impact has resulted in a roughly 28.6% drop in the purchasing power of the U.S. dollar since 2020.A breakdown of the specific eras and economic indicators across this timeframe illustrates the shifting landscape:Chronological Phases (2020 – 2026)2020: The Pandemic BaselineEconomic shutdowns caused demand for travel and energy to plummet.Annual inflation remained subdued at 1.2% to 1.4%, well below the Federal Reserve's target.2021: The Initial SurgePrices jumped rapidly to finish the year at 4.7% (with some months crossing 7%).Widespread supply chain bottlenecks, global shipping delays, and massive government stimulus fueled intense consumer demand.2022: The 40-Year PeakAverage annual inflation reached 8.0%, spiking specifically to a historic 9.1% in June 2022.The Russia-Ukraine war triggered global energy and food shocks, while domestic grocery prices soared by 20% to 25%.The Federal Reserve abandoned its "transitory" stance and began a aggressive tightening cycle, raising interest rates from near-zero to over 4% by year-end.2023 – 2024: The Cooling Period (Disinflation)Inflation cooled significantly down to 4.1% in 2023 and 2.9% by late 2024.Post-pandemic supply chain stresses fully dissipated, and high interest rates began to curb consumer borrowing and spending.2025: StabilizationInflation averaged 2.7%, hovering closer to the Fed's ultimate 2.0% target.Economic metrics began adjusting to the "new normal" of elevated living expenses.Mid-2026: The Energy Shock ResurgenceThe annual inflation rate has accelerated for three consecutive months, hitting 4.2% in May 2026.This latest spike is largely a headline metric inflation driven by an energy shock from conflicts involving Iran, causing retail gasoline prices to jump 40.5%.Core inflation (excluding food and energy) remains more controlled at 2.9%.Broad Economic Metrics SummaryMetric / Indicator6-Year Trend & ImpactPurchasing PowerA consumer basket costing $100 in 2020 requires roughly $128.67 to buy today.Core CommoditiesGrocery and gasoline prices have been the most volatile, fluctuating dramatically based on geopolitics.Shelter & HousingShelter costs remained stubbornly high and sticky, ticking up to 3.4% annually by May 2026.Real EarningsThough wages grew roughly 4% annually, higher prices caused inflation-adjusted "real" wages to decline for long stretches.Monetary ResponseThe Federal Reserve pushed benchmark interest rates above 5%, driving average mortgage rates from 3% to over 7%.Would you like to examine how specific sectors, such as housing markets or food costs, compared during this period, or look closer at the Federal Reserve's rate decisions?
https://i.postimg.cc/pdQzFGj0/dunning-kruger-effect.jpg
Which President was in office when inflation went off the rails? It wasn't Trump. Don't be mad at Trump because he can't fix the Democrat ****-up with a snap of the finger.
Johnny You: "Flying the pride flag is honorable".

15 Jun 2026 7:47 am
15 Jun 2026 8:05 am
JohnnyYou » 14 Jun 2026, 4:23 pm » wrote: ↑ Do any MAGAts give a flying ****?
They're busy trying to figure out how to afford food and gas.
not right DEI Johnny
only the entitlement crowd is bitching about the price of food and gas
but they were doing that before anyway...
the LGBTP Democrat party is comprised of professional bullies that shape shift into professional victims when challenged
seems your people are nothing but a raging sub-human haters that wants free stuff or they will terrorize those around them


15 Jun 2026 8:17 am
I heard we went up 5 Trillion in ND since Orange Fandango took office.ROG62 » 15 Jun 2026, 5:43 am » wrote: ↑ The main driver was dumping $4 trillion by democrats keeping the lazy **** at home spending money online…
I see you’re still toggling between “Mt Stupid” and “valley of despair”…
The Crypto benefits from debt somehow. Trump has incentive to run us into the ground.
DUMP THE TRUMP SLUMP 2026!
Bump Caps Recommended..
Bump Caps Recommended..
15 Jun 2026 9:07 am
JohnnyYou » 15 Jun 2026, 8:17 am » wrote: ↑ I heard we went up 5 Trillion in ND since Orange Fandango took office.
The Crypto benefits from debt somehow. Trump has incentive to run us into the ground.
 JuCo 5 percenter...72
“Show me the man and I’ll find you the crime” ~ LAVRENTIY BERIA
"Try to get past your passionate ignorance and learn to accept what actually happened." ~ brown's unheeded words of wisdom
If gender is not sex, why should a gender claim change what sex you shower with?
"Libruls are often fascists on vacation..."
JuCo 5 percenter...72
“Show me the man and I’ll find you the crime” ~ LAVRENTIY BERIA
"Try to get past your passionate ignorance and learn to accept what actually happened." ~ brown's unheeded words of wisdom
If gender is not sex, why should a gender claim change what sex you shower with?
"Libruls are often fascists on vacation..."
15 Jun 2026 9:43 am
You hand stays busy... jerk off much?

DUMP THE TRUMP SLUMP 2026!
Bump Caps Recommended..
Bump Caps Recommended..
15 Jun 2026 10:03 am
Examples or shut the **** up.
15 Jun 2026 7:17 pm
2x a week…
 JuCo 5 percenter...72
“Show me the man and I’ll find you the crime” ~ LAVRENTIY BERIA
"Try to get past your passionate ignorance and learn to accept what actually happened." ~ brown's unheeded words of wisdom
If gender is not sex, why should a gender claim change what sex you shower with?
"Libruls are often fascists on vacation..."
JuCo 5 percenter...72
“Show me the man and I’ll find you the crime” ~ LAVRENTIY BERIA
"Try to get past your passionate ignorance and learn to accept what actually happened." ~ brown's unheeded words of wisdom
If gender is not sex, why should a gender claim change what sex you shower with?
"Libruls are often fascists on vacation..." 
15 Jun 2026 7:19 pm

JohnnyYou » 14 Jun 2026, 4:23 pm » wrote: ↑ Do any MAGAts give a flying ****?
They're busy trying to figure out how to afford food and gas.
We stink of money, Jasper.
Please seat yourself.

I like the very things you hate.
I like the very things you hate.
16 Jun 2026 3:58 am
Aye.. I could eat a head of trendy arrugulla, if you paid me. I prefer Romaine..
DUMP THE TRUMP SLUMP 2026!
Bump Caps Recommended..
Bump Caps Recommended..
16 posts • Page 1 of 1
Who is online
In total there are 7797 users online :: 14 registered, 16 bots, and 7767 guests
Registered users: Johnny You, Blackvegetable, Squatchman, ROG62, ConservativeWave, Beekeeper, jerra b, LowIQTrash, PhiloBeddo, SouthernFried, Cannonpointer, Deezer Shoove, nefarious101, sole
Bots: MicroMessenger, CensysInspect, DuckDuckBot, okhttp, YandexBot, proximic, Bolt, Applebot, bingbot, Mediapartners-Google, facebookexternalhit, curl/7, CriteoBot, Googlebot, Baiduspider, ADmantX