
30 Dec 2020 3:17 pm

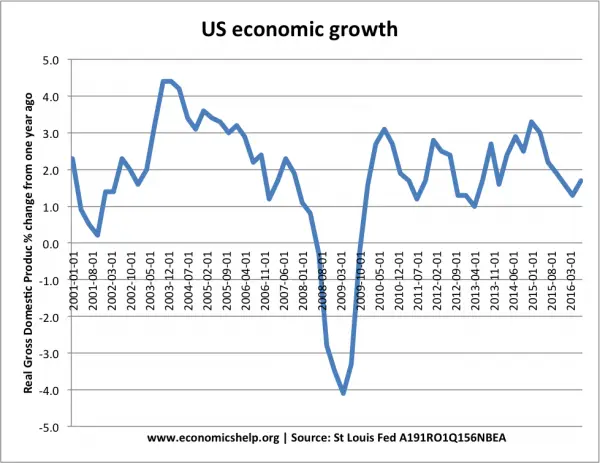
Then I'm at a loss to understand how you think that yet ANOTHER graph showing how Obama's election in late 2008 crashed the GDP all the way into October of 2009? That's the "truth" of this graph, isn't it? Of course, it also proves that in 8 years, Obama is the only president who was never able to get a single year of at least a 3% growth. Guess we could call that "Truth #2"!
Thanks for that!